| L o g P r o b a b i l i t y |
 |
|||
|
Many processes in nature produce probability distributions that
approximate a power law. One example is the distribution of
monetary wealth. Here are some simple computer experiments that
demonstrate how that might arise.
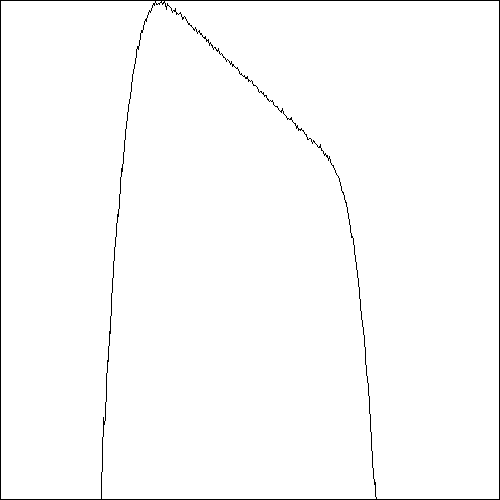
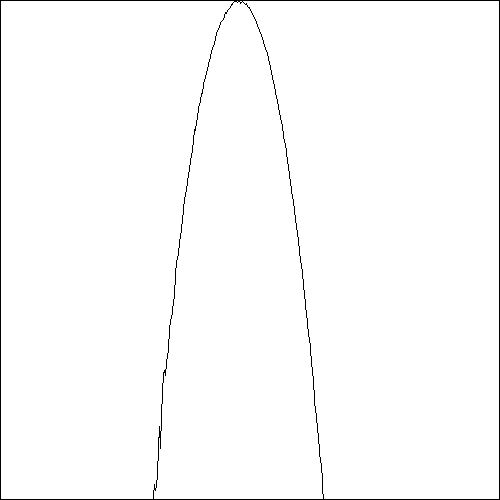
| In the first simulation, the rate is chosen uniform random over the allowed range with no memory of the past. Thus each individual executes a random walk, some years gaining wealth and other years losing it. The distribution of wealth after twenty years is shown on a double logarithmic scale of two decades in the graph at the right. The result is approximately Gaussian as expected. |
|
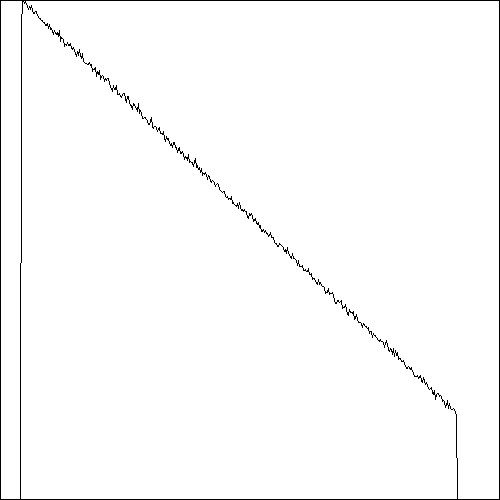
| In the second simulation, the rate is chosen
uniform random over the allowed range but with the same rate
for each person throughout the twenty year period. As one
would expect, the rich get richer and the poor get poorer so
that after twenty years the distribution of wealth is as
shown in the graph at the right. The result is quite
accurately a power law with a slope close to -1. The
cut-offs at the high and low ends each expand by 10% each
year. |
|
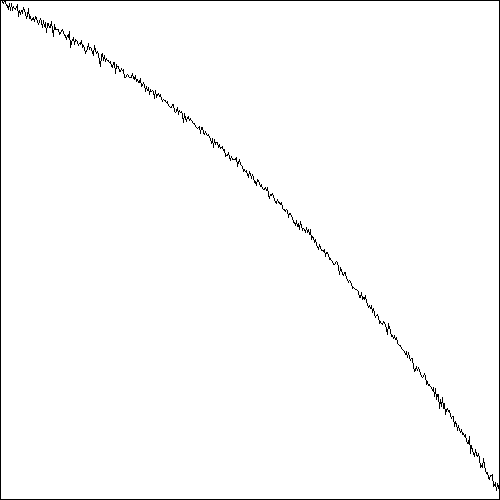
| In the third simulation, the rate each year
is half determined by the past and half chosen randomly,
with a result as shown in the graph at the right.
Interestingly, over a good portion of the range, the
distribution of wealth is still quite accurately a power law
with the same slope close to -1. As before, the range over
which the distribution is a power law expands in time. |
|
| This fourth simulation is the same as the second simulation except that the rates are chosen randomly from a Gaussian (normal) distribution with mean zero and standard deviation 10%. The results at the right show that the distribution of wealth after twenty years is not quite a power law, but it is far from a normal distribution and decreases monotonically over the indicated range. |
|
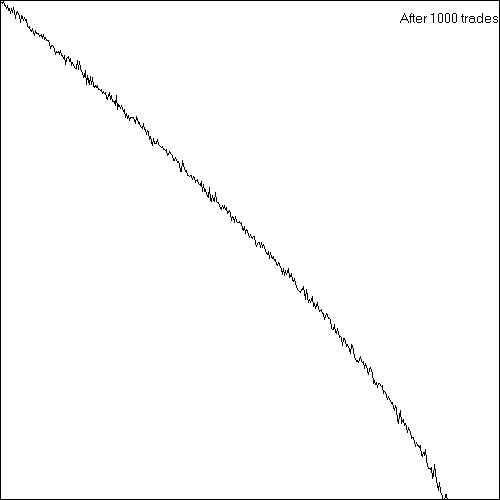
| This fifth simulation is the so-called "yard
sale model" in which each individual starts with $100,000
and executes 1000 trades with another randomly chosen
individual, for example by purchasing some goods or service.
In each trade, between 0 and 10% (randomly chosen) of the
wealth of the poorer individual is exchanged between the
two, half the time favoring the richer and half the time
favoring the poorer. The resulting distribution is still
roughly a power law despite the fact that all individuals
are treated as equals, other than the fact that each trade
is a larger fraction of the poorer's wealth. The PowerBASIC
code for the yard sale model is available for download. |
|